
Most enterprises now have AI features in production and very little idea whether they are working.
Source: Catchpoint SRE Report 2026
The applications shipped. The instrumentation did not.
This guide is about closing that gap. It covers what makes LLM and agent observability different from application monitoring, what to instrument, where the OpenTelemetry standard actually stands, which platforms serve which job, and the practices that separate teams who can debug an agent from teams who can only restart it.
Key takeaways
- LLM observability is a quality problem as much as a performance problem. A model call can return in 200 milliseconds, cost nothing unusual, and still be wrong, which means latency and error-rate monitoring alone will report a healthy system.
- Gartner’s Market Guide for AI Evaluation and Observability Platforms, published 2 February 2026, forecasts that 60% of software engineering teams will use these platforms by 2028, up from 18% in 2025.
- Agents raise the difficulty again. A single user request becomes a tree of model calls, tool calls and retries, so the unit of investigation is the whole run rather than one request.
- OpenTelemetry now has GenAI semantic conventions covering model spans, agent spans, metrics and events, with provider-specific conventions for Anthropic, OpenAI, AWS Bedrock and Azure AI Inference. They sit at Development status, so expect the attribute names to keep moving.
- Evaluation is the part teams skip and then need most. Running scored evaluations against versioned datasets in the deployment pipeline is what makes a prompt or model change safe to ship.
Why LLM observability is a different problem
Traditional observability answers whether a system is up and how fast it responded. Both questions have objective answers. A request either returned a 200 or it did not. For a language model, the equivalent questions have no single right answer, because the output is generated rather than retrieved, and two identical inputs can produce different responses.
That breaks the usual signal set in three ways. Correctness becomes a judgment rather than a status code, so something has to score the output.
Cost becomes variable per request, because tokens consumed depend on the input, the context attached and how much the model chose to say. And failure becomes partial: a response can be fluent, fast, cheap and wrong, which no threshold on latency or error rate will catch.
Gartner’s framing in its February 2026 Market Guide is that AI applications and agents are “inherently nondeterministic and opaque,” which is why the firm treats evaluation and observability as one market rather than two.
The guide defines AI evaluation and observability platforms as tools that automate the scoring of AI outputs against quality criteria such as accuracy, fairness and performance, and then feed logs, metrics and traces back into those evaluations.
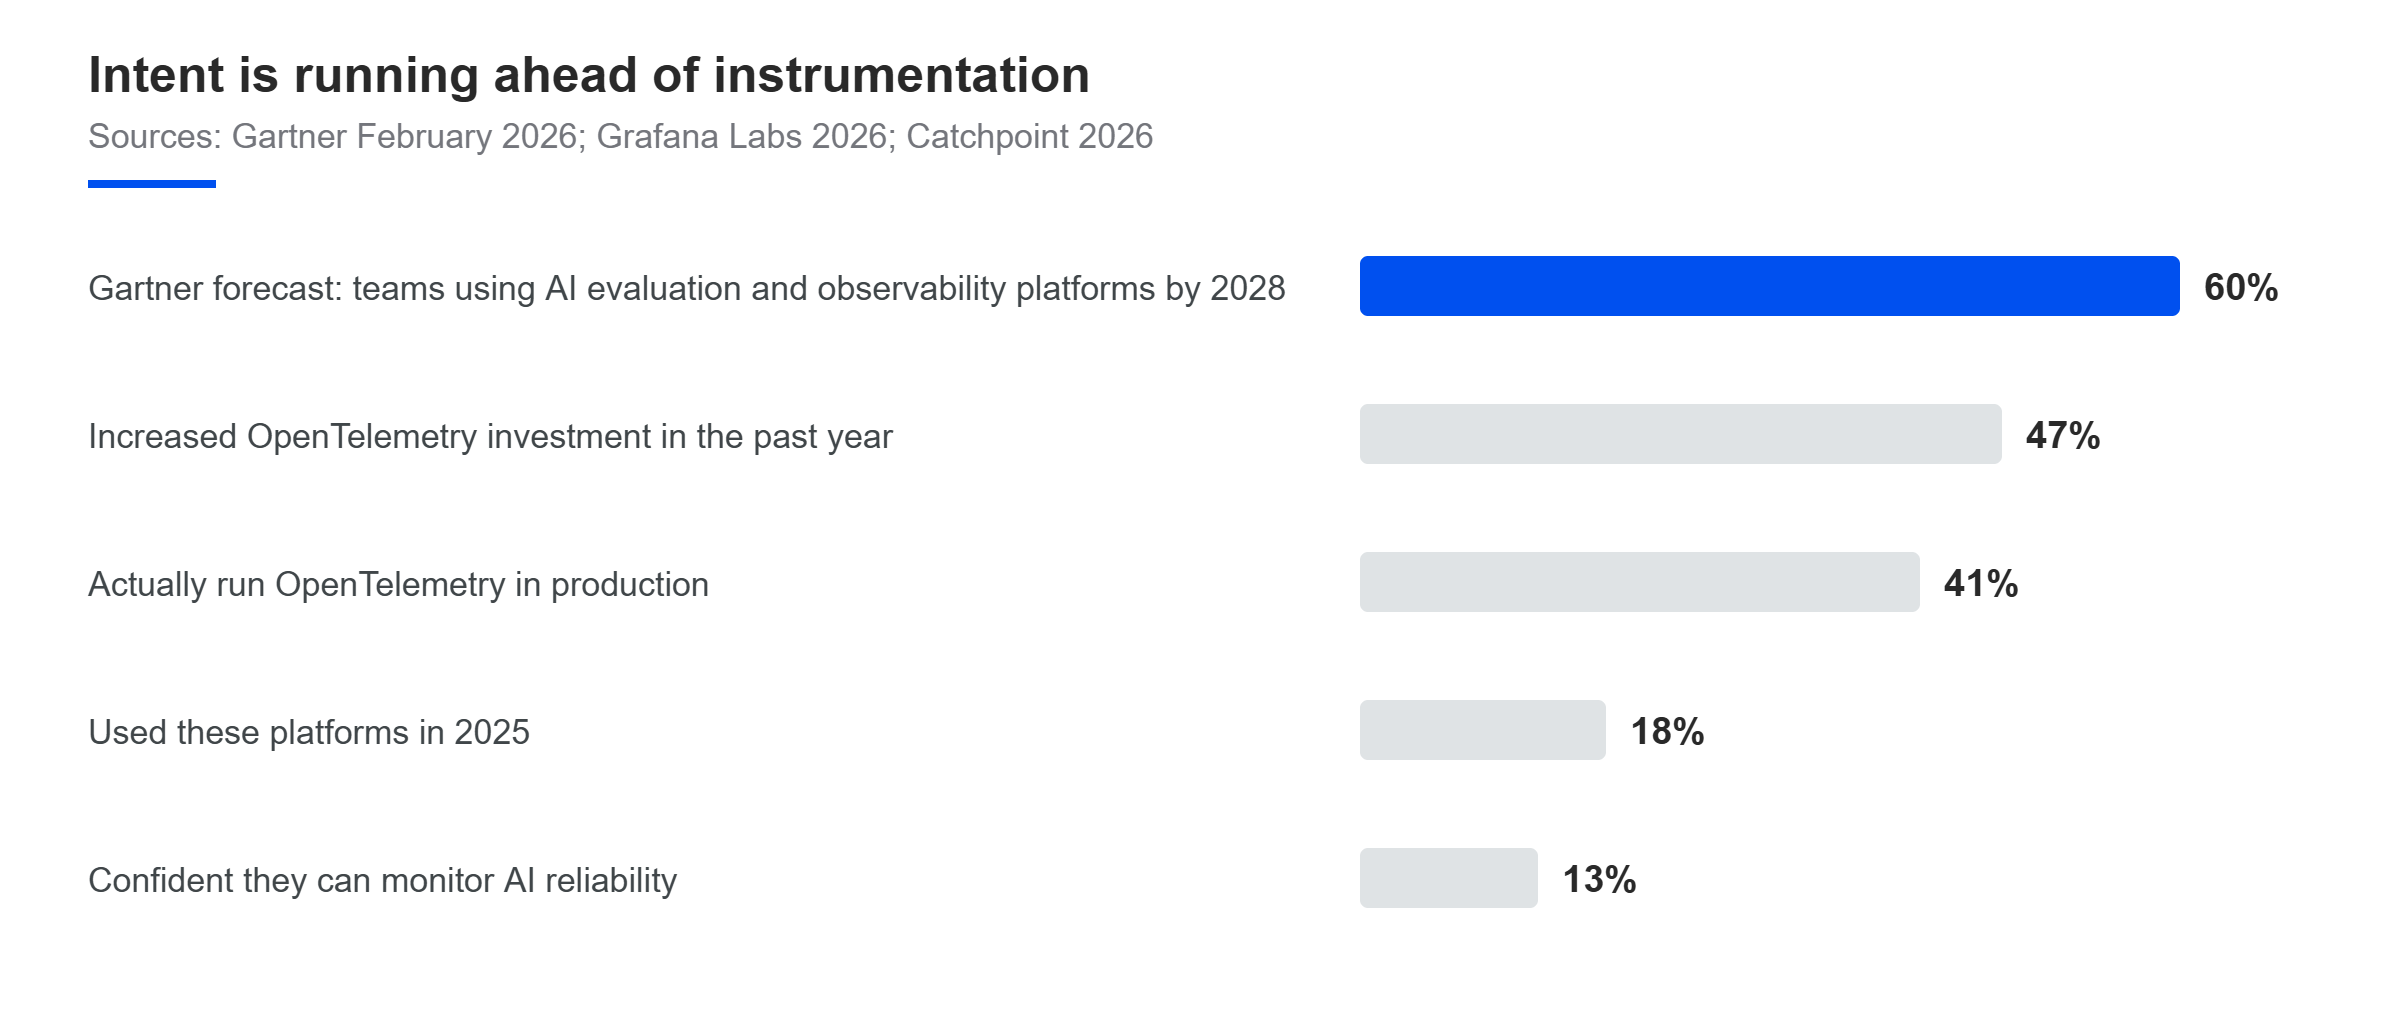
The numbers show a field that knows what it needs and has not built it yet. Gartner’s adoption forecast moves from 18% in 2025 to 60% by 2028.
Grafana Labs’ 2026 Observability Survey, fielded between 1 October 2025 and 6 January 2026 across 1,363 practitioners in 76 countries, found 47% had increased their OpenTelemetry investment over the past year while only 41% actually run it in production. And the Catchpoint confidence figure sits at 13%. Instrumentation intent is running well ahead of instrumentation reality.
What to instrument: the agent trace tree
For a single model call, the useful record is one span carrying the model name, the operation, token counts for input and output, latency, finish reason, and the prompt and response content where your privacy rules allow it. That alone answers most debugging questions about a chatbot or a summarizer.
Agents need a tree. One user request triggers a planning step, several tool calls, possibly a sub-agent, retries where a tool failed, and a final synthesis.
Each of those is a span, and the parent-child relationships are the information you need most, because the question in an agent post-mortem is almost never “was the model slow.” It is “which step went wrong, and what did the steps before it hand to it.”
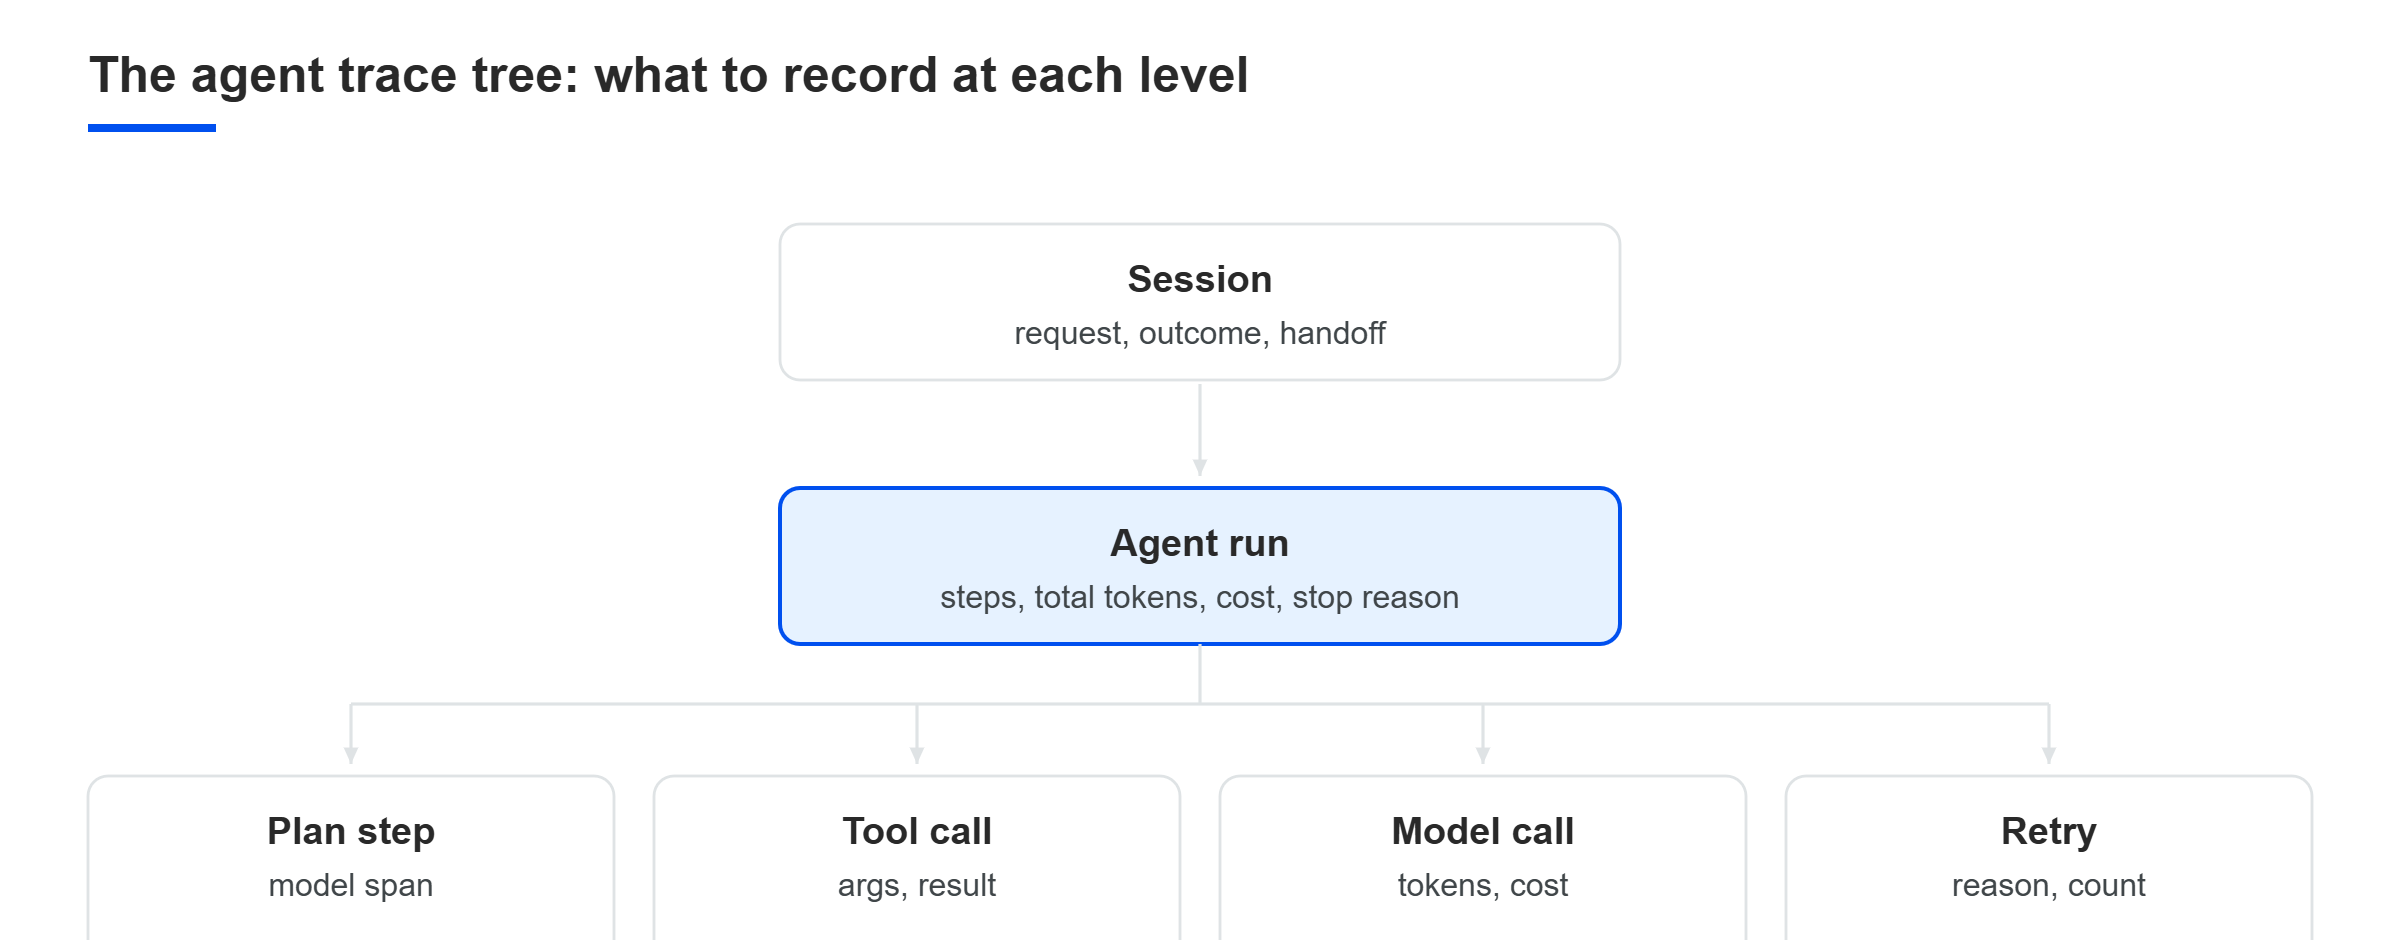
Three levels deserve their own treatment:
- Session level: record the user request, the final outcome and whether a human intervened.
- Run level: record the agent name, the number of steps taken, total tokens and total cost, and whether the run hit a step limit or a loop guard.
- Step level: record each model call and each tool call with its arguments, its result and its duration.
Tool calls are where agents fail most visibly and where instrumentation is most often missing. An agent that calls a search API with a malformed query, gets an empty result, and then confidently reports that no records exist has produced a wrong answer with no model error anywhere in the trace. Only the tool span shows it.
The signals worth alerting on
Four families of signal cover most production needs.
Quality signals
Quality signals come from evaluations rather than from the application. These include scores from an LLM-as-a-judge evaluator, rule-based checks such as schema validation or refusal detection, and human review samples. They are the only signals that detect a response that is wrong rather than broken.
Cost signals
Cost signals are token counts per request, per user, per feature and per model, plus the run-level total for agents. Cost per successful outcome is more useful than cost per call, because an agent that retries five times to get one right answer looks cheap per call and expensive per result. Grafana’s survey found cost has been the top tool selection criterion for three consecutive years, named by 65% of respondents.
Performance signals
Performance signals are the familiar ones with a twist: time to first token matters more than total latency for anything streaming to a user, and step count matters for agents because a run that takes twelve steps instead of four is usually a reasoning failure rather than a slow one.
Safety signals
Safety signals cover prompt injection attempts, PII appearing in prompts or responses, and guardrail triggers. Gartner lists runtime guardrails that detect hallucinations, PII leakage and prompt injection among the differentiating capabilities of these platforms rather than the mandatory ones, which is a fair reflection of how unevenly they are implemented.
The 2026 platform landscape
Gartner’s February 2026 Market Guide names twenty representative vendors, which is a useful map of a market that did not exist in this shape two years ago. The platforms divide roughly by what they were built to do first.
| Platform | Built around | Typical fit |
|---|---|---|
| Langfuse | Open-source tracing with evaluation and prompt management on top | Teams that want self-hosting and OTLP ingest |
| LangSmith (LangChain) | Tracing and evaluation tied closely to LangChain and LangGraph | Teams already building on LangChain |
| Braintrust | Evaluation-first workflow with datasets, scorers and CI gates | Teams treating evals as part of the pipeline |
| Arize AI | ML observability heritage extended to LLM tracing and drift | Organizations with existing ML monitoring practice |
| Comet (Opik) | Experiment tracking extended into LLM evaluation and tracing | Research-adjacent teams with model development in house |
| Galileo | Evaluation and guardrails with agent-specific failure analysis | Agent-heavy applications needing runtime checks |
| Fiddler AI | Model monitoring and explainability with governance reporting | Regulated industries needing audit evidence |
| Datadog LLM Observability | LLM traces inside an existing APM and infrastructure platform | Teams whose operations already live in Datadog |
The guide also names Airia, Confident AI, CoreWeave, Deepchecks, Evidently AI, HoneyHive, IBM, Maxim, Microsoft, Openlayer, Orq.ai, Patronus AI and Plurai. On the observability-platform side, Dynatrace, New Relic, Splunk and Weights and Biases Weave all ship LLM tracing into stacks that already carry the rest of the estate.
Choosing between them follows the same logic as the AIOps market. An organization whose operations team already works inside one observability platform usually gets more from that platform’s LLM module than from a better standalone tool nobody opens.
An organization whose AI work sits with a product or data science team usually gets more from an evaluation-first platform, because that team’s bottleneck is shipping prompt changes safely rather than watching dashboards.
Gartner sets a floor worth holding vendors to. Its mandatory capabilities include:
- A/B and multivariate testing of prompts and models
- Regression prevention when a model or prompt changes
- Safety and alignment checks
- Root-cause diagnosis from logs and traces
- Automated evaluation runs against datasets using code-based, human or LLM-as-a-judge evaluators
- Dataset management with versioning and ground-truth labelling
A platform missing dataset versioning cannot support a regression gate, whatever else it does well.
Where the OpenTelemetry standard actually stands
OpenTelemetry’s GenAI semantic conventions now live in their own repository, separate from the core semantic conventions, and they cover model spans, agent spans, metrics, events and exceptions, plus provider-specific conventions for Anthropic, OpenAI, AWS Bedrock and Azure AI Inference, and a related set for Model Context Protocol.
The important detail for planning is the maturity label: Development. The conventions are real, widely implemented and worth adopting, and the attribute names are still subject to change.
Teams instrumenting now should route telemetry through the OpenTelemetry Collector rather than wiring SDKs directly to a vendor endpoint, so that a convention change or a vendor change becomes a collector configuration edit instead of a redeployment of every service.
This is the same portability argument that applies to the rest of the estate, and the same evidence supports it. Grafana’s respondents named ease of adoption (41%) and freedom to switch vendors (37%) as their top reasons for choosing OpenTelemetry.
Best practices for 2026
A workable sequence for a team with AI in production and no observability on it:
- Instrument traces before dashboards. Get model spans and tool spans emitting through OpenTelemetry with token counts and costs attached. Everything else is built on this.
- Decide the content policy early. Prompts and responses are the most useful debugging data and often the most sensitive. Settle what gets recorded, what gets redacted and what gets sampled before the traces accumulate, not after a review asks.
- Build one evaluation dataset from production traffic. Fifty real examples with known-good answers beats a thousand synthetic ones. Version it.
- Put the evaluation in the pipeline. A prompt or model change that drops the score on the dataset should fail the build. Gartner lists regression prevention as mandatory for a reason: without a gate, every prompt edit is a production experiment.
- Alert on cost per outcome and on run length, not just on error rate. These are the two signals that catch an agent degrading rather than failing.
- Keep a human in the loop on anything consequential, and show the reasoning. Grafana found 95% of practitioners consider it important that AI shows its reasoning, and 15% do not yet trust AI to take action at all.
How Compunnel Digital helps
Compunnel Digital builds the platform layer that AI observability depends on, and governs the models running on top of it.
- Applied AI and Agentic Systems covers the AI Platform and LLMOps foundation for deploying, managing and optimizing LLM systems, along with Autonomous Operations and Agentic AI for multi-step agent workflows. AI-OS™ is the delivery platform for moving AI work from pilot to production, and AgentWeave™ and SearchCore™ provide the agent and retrieval foundations.
- Responsible AI, Governance and Assurance addresses the security, compliance and trustworthiness side, with ModelGuard™ as the governance layer that ships with every Compunnel AI engagement.
- Managed SRE and AIOps supplies the observability architecture underneath: metrics, logs, traces and operational visibility across environments, with ML-assisted event correlation, anomaly detection and root-cause analysis.
- Cloud-native accelerators: PlatformX™ supplies the observability and platform engineering patterns, and ShieldCI™ embeds security gates and detection into CI/CD pipelines so evaluation and safety checks run as part of delivery.
AI observability and governance assessment
Have AI features in production and no agreed way to tell whether they are behaving?
Talk to our teamSummary
LLM and agent observability is a quality problem as much as a performance problem, because a model call can be fast, cheap and still wrong. The practical path has four parts: trace the whole agent run as a tree of model calls, tool calls and retries; alert on quality, cost, performance and safety signals; pick a platform by the job it needs to do, using Gartner’s February 2026 Market Guide as a map; and build on OpenTelemetry GenAI conventions for portability while accepting that they are still at Development status. Start with evaluation, the step teams skip most often, and expand from there.
Frequently asked questions
What is LLM observability?
LLM observability is the practice of collecting and interpreting the data needed to understand how a language model application behaves in production. It covers traces of model and tool calls, token and cost accounting, latency, and quality scores from evaluations. It differs from application monitoring because output correctness is a judgment rather than a status code, so scoring is part of the instrumentation.
How is AI agent observability different from LLM observability?
A single model call produces one span. An agent run produces a tree of spans: planning steps, tool calls, retries, sometimes sub-agents. Agent observability adds the run as a unit of analysis, with step counts, loop detection, per-run cost and the parent-child structure that shows which step failed and what it was given.
Does OpenTelemetry support LLM and agent tracing?
Yes. OpenTelemetry has GenAI semantic conventions covering model spans, agent spans, metrics and events, with provider-specific conventions for Anthropic, OpenAI, AWS Bedrock and Azure AI Inference, maintained in a dedicated repository. They are at Development status, so attribute names can still change, and routing through the Collector limits the cost of that churn.
What are the best LLM observability tools?
It depends on which job comes first. Langfuse, LangSmith, Braintrust, Arize, Comet Opik, Galileo and Fiddler lead on tracing and evaluation, while Datadog, Dynatrace, New Relic and Splunk fold LLM traces into platforms that already hold the rest of the estate. Gartner’s February 2026 Market Guide names twenty representative vendors in the category.
What should we monitor first in an LLM application?
Traces with token counts and cost, then one evaluation dataset built from real traffic. Traces make incidents debuggable and evaluations make changes safe. Dashboards and alert thresholds are easier to design once both exist.
Conclusion
AI observability is where application observability was a decade ago: the standard exists, the tooling is consolidating, and most teams have shipped faster than they have instrumented. The gap is visible in the numbers, with 13% of reliability professionals confident they can monitor AI reliability against a Gartner forecast of 60% platform adoption by 2028. Closing it starts with traces through OpenTelemetry, a content policy decided in advance, one versioned evaluation dataset drawn from production, and an evaluation gate in the pipeline so a prompt change cannot quietly degrade a live feature.
Explore how our Applied AI and Agentic Systems practice builds governed AI platforms with observability designed in.
Sources
- Gartner, Market Guide for AI Evaluation and Observability Platforms (G00842253), 2 February 2026, Manjunath Bhat, Alex Coqueiro and Wilco van Ginkel
- OpenTelemetry, GenAI semantic conventions repository and GenAI conventions documentation
- CNCF, OpenTelemetry graduation announcement, May 2026